|
|
Sociology 441: Stratification
|
|
|
Sociology 441: Stratification
|

| |
| Other family trend graphs: |
| Unmarried fertility |
| Marriage rates |
| Age at marriage |
| Divorce |
| Female headed households |
| |
| Poverty trend graphs: |
| Poverty |
| Poverty by age |
| Poverty by education |
| Poverty by race/ethnicity |
| |
| |
| |
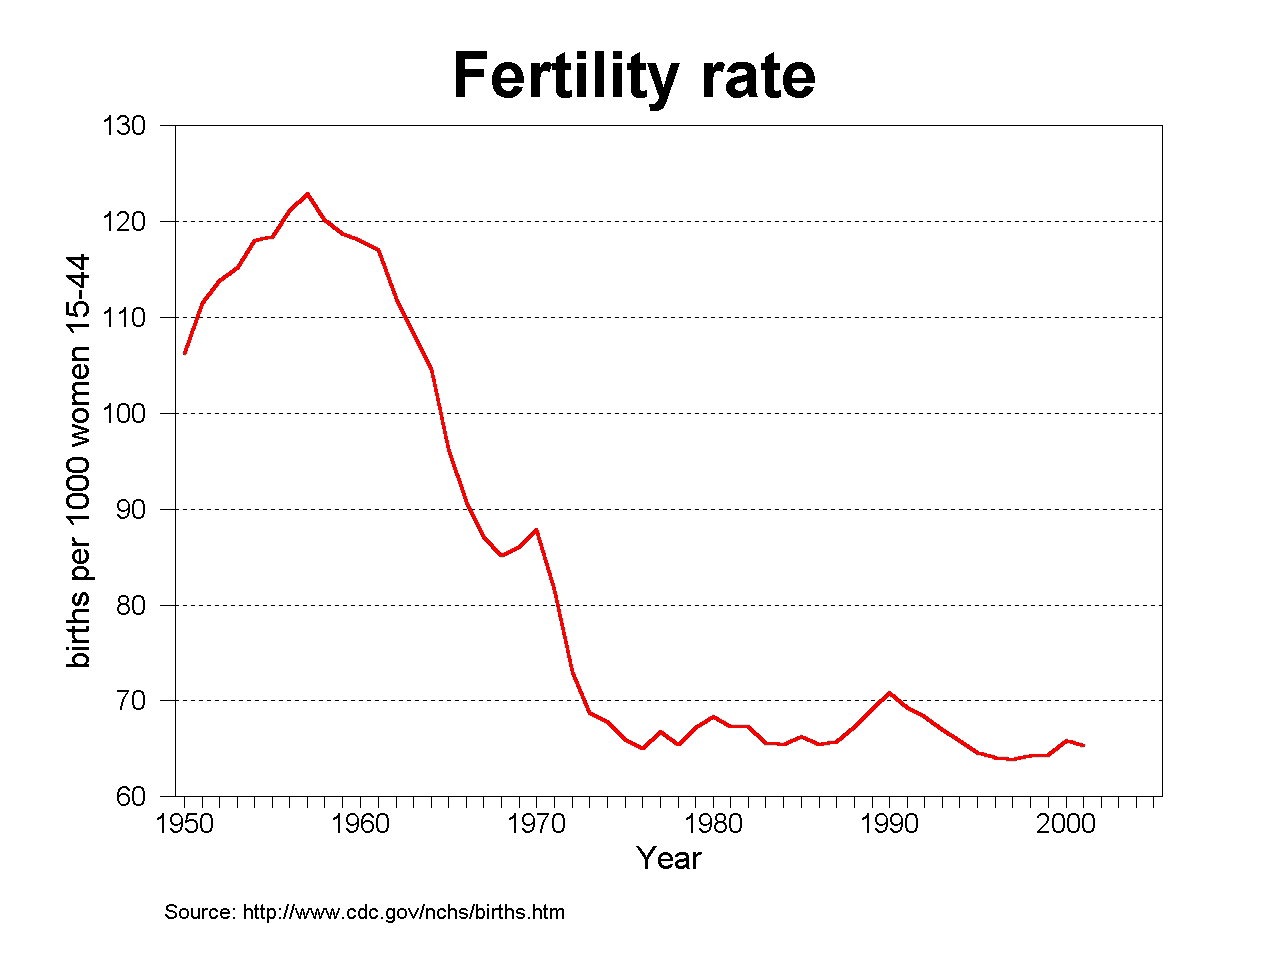
Source: National Center for Health Statistics
http://www.cdc.gov/nchs/births.htm
| return to: | Sociology 441 home page | Sociology 441 list of figures |
| Last updated December 11, 2003 |
comments to: Reeve Vanneman.
reeve@umd.edu
|